
Inflation’s effects on the economy, monetary policy, and the financial markets are wide-ranging. Higher inflation can constrain economic growth, tighten financial conditions, drive interest rates higher and even restrain stock valuations — higher inflation dampens the present value of future earnings and, historically, correlates with lower stock valuations. Will the recent encouraging reports on inflation convince the Federal Reserve (Fed) to cut rates sooner rather than later? In this week’s Weekly Market Commentary, we explore the current inflation dynamics, how stocks react within various inflation scenarios, and what sectors have rebounded the most since the initial tariff tantrums.
How Long Can This Last?
Investors cheered the latest inflation statistics, giving reason for some to call for the Fed to cut rates. And a (dubious) reason to call for a new Fed chairman, but more on that later. So, what was the impetus for such reactions? The Consumer Price Index (CPI) for May came in below expectations for the fourth consecutive month, proving to some that inflation is no longer the biggest risk for policymakers. However, the big unknown is how much impact — if at all — did tariffs have on consumer prices. Consumer prices in May rose 0.1% month over month, after rising 0.2% in April. Annual inflation according to this metric is 2.4%, and core inflation (excluding food and energy) is 2.8%, still higher than the Fed’s 2% target.
Inflation looks more restrained according to the Fed’s preferred metric taken from the April Personal Income and Spending data. A call for patience is in order since this metric will be updated later in the month. We will get the May data on June 27.
Did tariffs impact inflation? Perhaps investors were overly pessimistic given their expectations that CPI would run hotter than it did over the last four months. Surprisingly, new and used vehicle prices declined in May, despite many expecting an increase in prices from tariffs. Even more surprisingly, apparel prices declined the last two months, indicating that these companies likely absorbed tariff costs.
Prices for apparel and autos, both highly sensitive to trade conditions, could reverse course in the coming months if demand holds up. According to the reported pricing pressures from the ISM Survey, we should expect inflation to reaccelerate later this year, keeping the Fed committed to higher-for-longer rates. Concerning the call from the President that Fed Chairman Jerome Powell should be replaced, investors should focus on a few relevant things during these times of flux: the Fed is best run when it is independent from political meddling, and markets are most comfortable with a Fed managed by stable, experienced hands.
Survey Says Inflation Pressures Rising
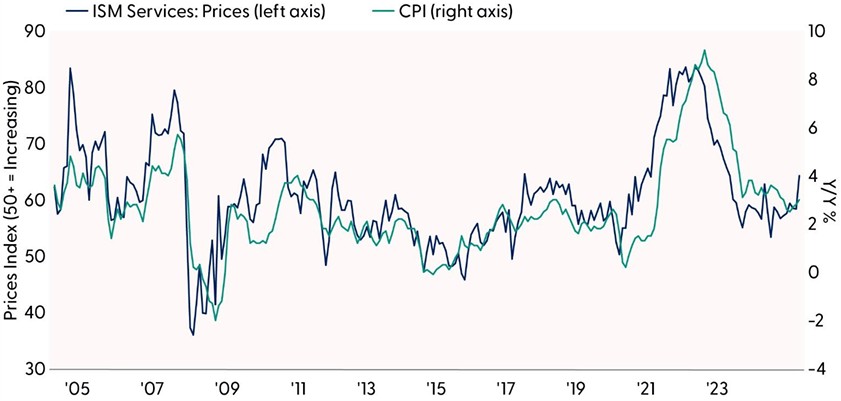
Source: LPL Research, Bloomberg 06/16/25
Past performance is no guarantee of future results.
All indexes are unmanaged and can’t be invested in directly.
Could Inflation Spike from Middle East Conflicts?
Israel launched a series of airstrikes across Iran on Thursday, targeting nuclear facilities and killing senior military leaders, including the head of the Islamic Revolutionary Guard Corps. Of course, this marks a significant escalation in Middle East tensions, with Iran vowing additional retaliation (they’ve already launched drone attacks against Israel as we write this) and global markets reacting swiftly. To the surprise of no one, oil prices spiked and traditional safe-haven assets like gold got a bid. The initial market response has been largely contained, but the risk of a broader military conflict certainly cannot be dismissed.
Historically, the stock market has tended to hold up well to geopolitical crises after initial bouts of volatility. Based on dozens of such shocks across seven decades, the average S&P 500 drawdown during such events has been slightly less than 5% over an average period of 19 days, with a full recovery typically occurring within six weeks. While the immediate reaction may be sharp, long-term economic and market fundamentals often reassert themselves once uncertainty fades.
The main determinant of returns after these events are fully digested by markets is not the severity of the event but whether it coincided with or caused a recession. Assuming no imminent recession, which is LPL Research’s base case scenario, history shows that stocks have frequently risen over the next three, six, and 12 months after geopolitical and economic shocks. Look for more on this from us in a blog on LPL.com shortly.
In terms of where this conflict goes and what it means for Iran, the Middle East, and global energy and financial markets, we’ll have to wait and see. But we know one thing for sure. If Iranian oil production is significantly disrupted, oil will go much higher and lift headline inflation, which clearly makes the Fed’s job tougher. Oil and gold remain good hedges for this conflict, in our view.
Inflation and the Stock Market
The future path of inflation is critically important for several reasons beyond the effects on consumer prices, monetary policy, and interest rates, which get the most investor attention. Inflation also matters for stock valuations. At the simplest level, stock prices reflect the present value of future cash flows. More inflation and higher interest rates reduce the value of those future profits in present-day dollars. The data illustrates this relationship, shown in the “Higher Inflation Tends to Lower Stock Valuations” chart. The highest stock valuations have been observed when inflation, represented by the CPI, is lowest, and vice versa.
This study also highlights current elevated valuations. The price-to-earnings ratio (P/E) of the S&P 500, even using consensus estimates for earnings per share over the next 12 months that are likely too high, is near 22 times. This multiple is several points higher than the historical average, even in low inflation environments. For stocks to break through all-time highs and sustain additional gains from there, it will likely require a combination of lower inflation, lower interest rates, and an unexpected positive earnings surprise — potentially from passage of the tax bill currently working its way through Congress.
Higher Inflation Tends to Lower Stock Valuations
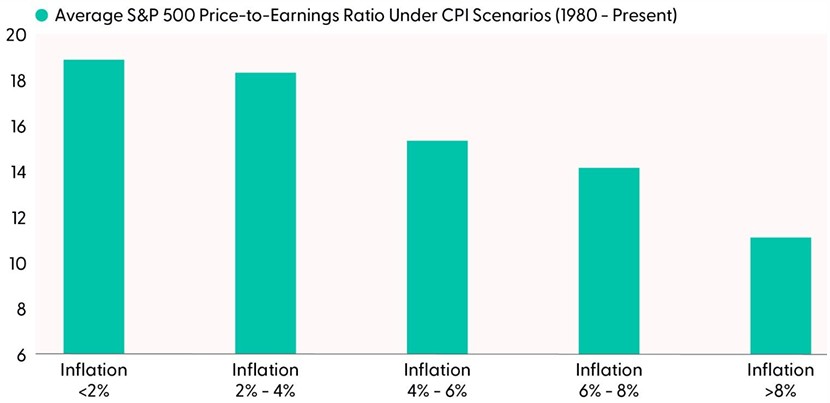
Source: LPL Research, Bloomberg 06/13/25
Past performance is no guarantee of future results.
All indexes are unmanaged and can’t be invested in directly.
Good Things Come to Those Who Wait
Despite our focus on inflation, trade policy got a lot of attention last week. Much of the recent market gyrations were from tariff-related statements from world leaders. It has only been about two months since the market spiraled into the April 8 correction low. The fall from grace was sharp and painful, as the S&P 500 went from a record high of 6,144 on February 19 to the April 8 correction closing low of 4,983, marking a peak-to-trough drawdown of 18.9%. The subsequent recovery has been nothing short of impressive as the broader market quickly pared its correction losses and climbed back toward record highs.
Technology — the largest S&P 500 weight (~32%) and the hardest hit during the drawdown — has led the charge with nearly a 34% rally since April 8 (as of June 11). Communication services, industrials, and consumer discretionary round out the rest of the recovery leaderboard with gains of over 20%. Defensive sectors, including consumer staples, healthcare, and utilities, have underperformed significantly over the last two months. The shift back to cyclical leadership and broad participation in the rally off the correction lows are key factors supporting a sustainable recovery for the broader market.
Returns Into and Out of the Correction Lows
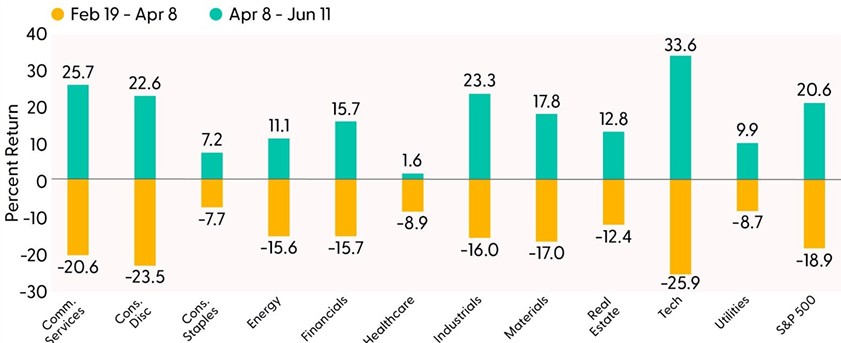
Source: LPL Research, Bloomberg 06/19/25
Past performance is no guarantee of future results.
All indexes are unmanaged and can’t be invested in directly.
Investors have now been waiting around four months for the S&P 500 to reach a record high. While for many, it may feel like an eternity given the volatility and market drama since February. However, the waiting game could be much worse when comparing the current pause in new highs to prior periods. For example, it took the S&P 500 6,249 trading days (~25 years) to recapture the pre-Great Depression highs set in 1929. Fortunately, we suspect the wait could be over soon — not a bold call considering the S&P 500 is only around 2% away from recapturing the February 19 high at 6,144.
If the market registers a new high, the next obvious question from investors is, what happens next? Using history as a guide, we have found that momentum has historically continued after a new high is registered. Over the last 70+ years, the S&P 500 has generated an average 12-month price return of 9.7% after posting a meaningful new high (we defined meaningful as a record high occurring at least 60 trading days after a prior high). Furthermore, roughly three-quarters of these occurrences also produced positive returns over the 12-month period.
A Watch Party Is In Order
A record-high watch is now in effect for the S&P 500 as it hovers about 2% below its February high. Technically, a close above 6,144 would validate a breakout to new highs. Bullish but not overbought momentum, relatively light investor positioning, and sanguine but not stretched investor sentiment all suggest this rally could have more room to run. The return of cyclical leadership and broad participation since the April 8 low provides additional technical evidence of a sustainable recovery. Historical data also suggests momentum tends to continue after a record-high drought finally ends.
Conclusion
Investors welcomed recent inflation data, fueling demands that the Fed cut rates. Consumer inflation for May came in lower than expected for the fourth straight month, though tariffs’ impact on prices remains uncertain. While overall inflation rose 0.1% month over month and core inflation stands at 2.8%, it is still above the Fed’s 2% target. The Fed’s preferred measure will be released June 27.
Tariffs have not significantly raised prices yet, as used vehicle and apparel costs declined, suggesting businesses absorbed some costs. Inflation may reaccelerate later in the year, keeping the Fed on track for higher-for-longer rates. Meanwhile, political pressure mounts over Fed leadership.
Middle East tensions escalated as Israel launched airstrikes on Iran, leading to oil and gold price surges. Market reactions have been contained, but further conflict could push oil prices higher, making the Fed’s inflation fight harder. Historically, stocks have recovered well after geopolitical events, provided no recession follows.
Inflation’s effect on stock valuations remains crucial — higher inflation dampens the value of future earnings, while historically, low inflation correlates with higher stock valuations and vice versa. The S&P 500 recovery has been remarkable since its April 8 correction low, driven by technology, communication services, and industrials.
While the technical setup continues to improve, fundamental and macro risks remain. A lot of good news is arguably priced into the market, longer duration Treasury yields remain volatile, and trade policy uncertainty is still elevated despite some notable progress. Any further material gains will likely require an upside earnings surprise, lower than-anticipated tariff rates, passage of President Trump’s “Big Beautiful Bill” with limited concessions, and carefully balanced lower Treasury yields.
Asset Allocation Insights
We advise against increasing portfolio risk beyond benchmark targets at this time, as the market seems to be factoring in a lot of positive news. Additionally, the fixed income market remains volatile, with longer-term yields nearing critical levels for risk appetite in stocks.
LPL’s Strategic and Tactical Asset Allocation Committee (STAAC) maintains its tactical neutral stance on equities. Following the recent stock market rebound, the Committee does not rule out the possibility of a reversal lower amid ongoing uncertainty around tariffs. LPL Research continues to monitor tariff negotiations, economic data, earnings, the bond market, and various technical indicators to identify a potentially more attractive entry point to add equities on weakness.
Within fixed income, the STAAC holds a neutral weight in core bonds, with a slight preference for mortgage-backed securities (MBS) over investment-grade corporates. In our view, the risk-reward for core bond sectors (U.S. Treasury, agency MBS, investment-grade corporates) is more attractive than plus sectors. We believe adding duration isn’t attractive at current levels, and the STAAC remains neutral relative to our benchmarks. The Committee would get more interested in adding long-term bonds if the U.S. 10-Year Treasury yield got closer to 5%.
Important Disclosures
This material is for general information only and is not intended to provide specific advice or recommendations for any individual. There is no assurance that the views or strategies discussed are suitable for all investors or will yield positive outcomes. Investing involves risks including possible loss of principal. Any economic forecasts set forth may not develop as predicted and are subject to change.
References to markets, asset classes, and sectors are generally regarding the corresponding market index. Indexes are unmanaged statistical composites and cannot be invested into directly. Index performance is not indicative of the performance of any investment and do not reflect fees, expenses, or sales charges. All performance referenced is historical and is no guarantee of future results.
Any company names noted herein are for educational purposes only and not an indication of trading intent or a solicitation of their products or services. LPL Financial doesn’t provide research on individual equities.
All information is believed to be from reliable sources; however, LPL Financial makes no representation as to its completeness or accuracy.
All investing involves risk, including possible loss of principal.
US Treasuries may be considered “safe haven” investments but do carry some degree of risk including interest rate, credit, and market risk. Bonds are subject to market and interest rate risk if sold prior to maturity. Bond values will decline as interest rates rise and bonds are subject to availability and change in price.
The Standard & Poor’s 500 Index (S&P500) is a capitalization-weighted index of 500 stocks designed to measure performance of the broad domestic economy through changes in the aggregate market value of 500 stocks representing all major industries.
The PE ratio (price-to-earnings ratio) is a measure of the price paid for a share relative to the annual net income or profit earned by the firm per share. It is a financial ratio used for valuation: a higher PE ratio means that investors are paying more for each unit of net income, so the stock is more expensive compared to one with lower PE ratio.
Earnings per share (EPS) is the portion of a company’s profit allocated to each outstanding share of common stock. EPS serves as an indicator of a company’s profitability. Earnings per share is generally considered to be the single most important variable in determining a share’s price. It is also a major component used to calculate the price-to-earnings valuation ratio.
All index data from FactSet or Bloomberg.
This research material has been prepared by LPL Financial LLC.
Not Insured by FDIC/NCUA or Any Other Government Agency | Not Bank/Credit Union Guaranteed | Not Bank/Credit Union Deposits or Obligations | May Lose Value
For public use.
Member FINRA/SIPC.
RES-0004479-0525 Tracking #754838 | #755276 (Exp. 06/26)